
The Geography of Work
By now almost everyone knows that modern America is afflicted with a work problem. It's a chronic and generally worsening condition that we just don't seem to be able to shake. And its broad outlines are depressingly familiar: Steadily growing numbers of American adults have been dropping out of the workforce, and it seems difficult, if not impossible, to lure many of them back in.
For the civilian population as a whole, the share of Americans working or looking for work — the labor-force participation rate, or LFPR — has been falling for about a quarter-century. Among men of prime working age (those 25 to 54 years old), who are crucial to both economic production and social reproduction, LFPRs have been falling for over half a century, since the mid-1960s. Meanwhile, the LFPRs for the broader cohort of 25-to-64-year-old Americans — men and women together — are lower today than they were 30 years ago.
Thanks to declining LFPRs, America has exhibited a bizarre paradox: national unemployment rates that should be consistent with full employment, combined with prime-age male work rates mirroring those from the last year of the Great Depression. Today, in our post-pandemic economy, declining LFPRs manage to co-exist with an unprecedented peacetime labor shortage. Although employers across the country are practically begging for workers, and job applicants enjoy more bargaining power than at any time in living memory, about 11 million open positions in the private sector and government offices remain unfilled as of this writing.
America's workforce-participation problem has been studied exhaustively — but only after a fashion. It has also been subject to a curious — and consequential — blind spot among scholars and policymakers alike.
Over the past decade alone, many hundreds of studies and reports have examined America's LFPRs: patterns, trends, correlates, determinants, consequences, policy options, and alternatives. Yet almost all of this work has been devoted to tracking and assessing national conditions — aggregate results for the country as a whole. Hardly any attention has been accorded to the differences in LFPRs within America.
As it happens, local variations in LFPRs within America today are significant — indeed extraordinary. As we shall see, a stunning 50-plus percentage-point gap separates rates in America's highest and lowest LFPR metropolitan areas. Between these extremes lies a remarkable national dispersion of local performance that has occasioned strangely little interest.
By some indications, domestic discrepancies in America's LFPRs look to be increasing, and may have been doing so for decades. Growing gaps in LFPRs between localities — due mainly to the collapse of work rates and workforce participation — are also directly associated with the drop in national averages in labor-force participation. Yet the topic has gone almost entirely unexamined in academic and policy circles. It's well past time for that to change.
AN UNDER-EXAMINED PUZZLE
The paucity of research on domestic differentials in LFPRs is especially striking in light of the enormous volume of economic, social-science, and policy publications on the general topic of workforce participation in the United States.
Over the past decade alone, a fair-sized library of scholarly and policy work has been generated on American workforce participation. We can get a sense of the sheer scale of the output in this area by looking at a few academic databases. Simple searches show the number of relevant studies in the past 10 years to be between several hundred and several thousand.
Yet when we look for studies examining regional or local differentials and their determinants or correlates, results become extremely thin. In our literature review, we identified only a handful of studies either examining or attempting to explain the magnitude of workforce-participation differentials within the United States this last decade.
In fairness, that handful includes some significant, highly informative scholarship. But the very merit and value of those few studies only sharpens the question of why more attention has not been accorded to such a potentially interesting and important matter.
Three factors may help to explain this neglect. First, the principal "go to" statistical data source on American employment — the one academics, policymakers, and financial analysts commonly rely on, and the one almost all current U.S. jobs-market research is based on — is designed and intended to track labor-market conditions for the nation as a whole. This is the Current Population Survey (CPS), which is produced by the Census Bureau and the Bureau of Labor Statistics (BLS). The CPS generates the "monthly jobs report" — always eagerly awaited in Washington and on Wall Street — which is used for most economic, social-science, and policy research analyses of American workforce trends and patterns. Yet given its sample size (minimized to reduce expense), the CPS cannot provide timely and reliable information on subnational employment patterns.
Other data sources pertaining to local employment conditions are of course available, but they are generally less familiar to researchers and policymakers, and also tend to be less user-friendly. That is revealing in itself, and could bear on a second factor at play: predispositions or habits of mind encouraged by contemporary economic training.
Key among these is the tenet that markets tend to seek equilibrium following shocks or disruptions. Given that America has a national economy with a nationwide labor market — wherein capital, labor, and other factors of production move or are reallocated according to market conditions — the presumption of a tendency toward interregional equilibrium in labor conditions may make investigating existing differences in LFPRs seem less pressing. Major post-war regional changes within the country — the rise of the Sun Belt, marked alleviation of poverty in the Old South since the 1960s, and the population's continuing migration to new centers of opportunity — may reinforce such predispositions.
But serious economists do not invest naïve faith in a smooth and seamless labor-market equilibrium. In fact, some of the most important work in contemporary labor economics has focused on the shortcomings of equilibrating processes in labor markets. "Hysteresis" in labor markets — slow adjustments to unemployment shocks and the long influence of such shocks in employment patterns — came to researchers' attention in the 1980s, thanks largely to Olivier Blanchard (then of the Massachusetts Institute of Technology) and Lawrence Summers of Harvard University. Then in the early 1990s, Blanchard and Harvard's Lawrence Katz examined lags in adjustment to employment shocks in the United States and why unemployment might take longer to return to normal levels after a recession in some parts of the country than in others.
Notably, this path-breaking work focused on unemployment rather than workforce participation — and not just because unemployment was a socioeconomic problem in its own right, but because it was taken for granted in those days that unemployment rates were meaningful predictors of employment levels. That same presumption is a third factor helping to explain the relative lack of interest in local LFPR differentials: Information on local unemployment rates, available through a BLS data system originally designed in the shadow of the Great Depression, was thought to suffice. For better or worse, that premise is no longer valid in our time, when low unemployment rates and low employment rates are occurring simultaneously.
The figures below illustrate the problem. They incorporate data on employment, unemployment, and LFPRs for 510 American "metropolitan statistical areas" (MSAs) drawn from the Census Bureau's American Community Survey (or ACS, which uses a much larger sample than the CPS) on the eve of the Covid-19 pandemic. MSAs are geographic areas that contain at least one core urban cluster (regions with populations of 10,000 to 50,000 for micropolitan areas and 50,000 or more for metropolitan ones), "plus adjacent territory that has a high degree of social and economic integration with the core as measured by commuting ties." There are over 900 MSAs in the United States, and although LFPRs in ACS one-year estimates are available for only about 500 of them, they encompass about 90% of the American population.
By 2019, there was an almost perfect correlation — an R-squared of 0.98 — between the civilian population's LFPR and its employment rate in MSAs all across America. On the other hand, the correlation between employment and unemployment rates was barely a third as strong: Its R-squared was just 0.32. While an almost one-for-one relationship existed between changes in the LFPR and the employment rate, by 2019, it took a two-percentage-point change in employment rates to elicit a one-point change in unemployment.
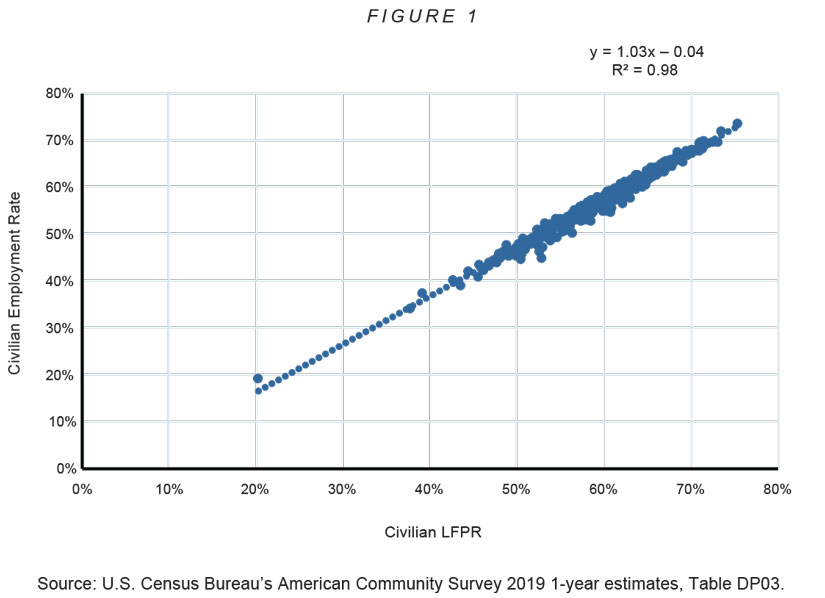
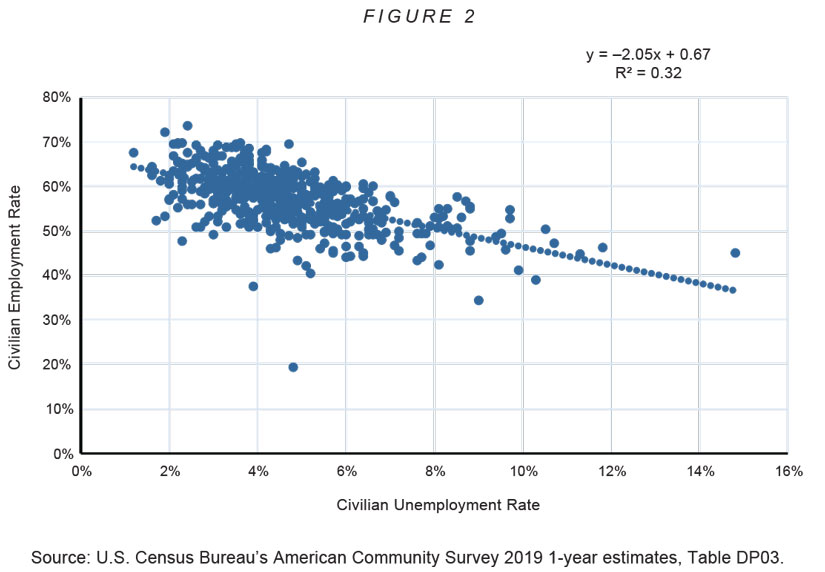
These correlations cover the entire civilian population of Americans aged 16 and above — meaning they include the LFPRs of those aged 65 and older, too. But even if we exclude seniors and parse the labor-force groupings under consideration by age and sex into more narrowly defined cohorts, we find the same thing: Local LFPRs are a much better predictor of employment rates across the country than unemployment rates. There are compelling reasons for paying attention to unemployment rates, of course, but in our low-unemployment, low-work labor market, LFPRs have come to provide much more information on employment levels in America than unemployment rates can offer.
VAST DIVERGENCE
Just how dramatic are America's domestic variations in LFPRs? Consider the situation in the country in 2019 — just before the Covid-19 calamity and 10 years into the economic expansion that followed the Great Recession.
In 2019, according to the ACS, over 75% of civilian men and women aged 16 and older were either working or looking for work in Fargo, North Dakota (population 246,000). By contrast, the adult LFPR was just 20% in The Villages, Florida (population 132,000). This amounts to an LFPR difference of 55 percentage points between two metropolitan areas within the same country in the same year.
Of course, these extremes largely reflected big compositional differences arising from the exceptionally discrepant population structures of these two locales. The Villages is an "age-restricted community" with a median age in 2019 of almost 70. In Fargo — a fracking boomtown as of 2019 — the median age was less than half as high: about 34.
But standardizing for age by no means eliminates today's differences in LFPRs between American population centers. In 2019, Fargo's "prime-age" (25 to 54) LFPR for men and women stood at 92% (see the table below). Compare that to the 62% prime-age LFPR for Pine Bluff, Arkansas. And this is not a one-off instance: A prime-age LFPR difference of nearly 30 percentage points separated Lawrence, Kansas, from Show Low, Arizona. The difference was almost 27 points between Dubuque, Iowa, and Gallup, New Mexico. A 25-point gap stood between Rochester, Minnesota, and El Centro, California. And so on.
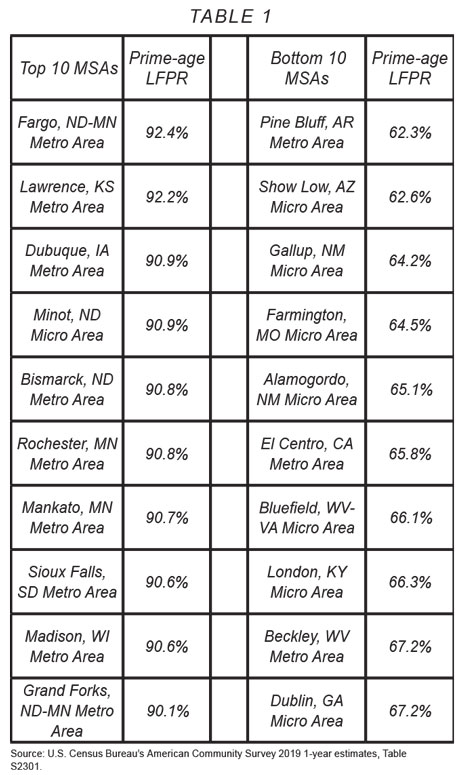
The spread of LFPRs within American MSAs for other age groupings are just as noteworthy. For the 20-to-64 age group, which encompasses about 90% of America's economically active manpower, the overall high-to-low range for LFPRs amounted to 31 percentage points. That span exceeded 34 points for men aged 20 to 64, with a 31-point range for women in the same age cohort. LFPRs for senior citizens aged 65 and older averaged just 19% for the country as a whole, but their range within America's MSAs in 2019 exceeded 22 percentage points — with Fairbanks, Alaska's LFPR reportedly four times higher than that of Talladega-Sylacauga, Alabama.
Big differences in local LFPRs are not just statistical artifacts reflecting the straits of some smaller, forgotten communities; major LFPR differentials are evident across the country no matter the population threshold. Among MSAs of a quarter-million or more, the prime-age spread was 18 points in 2019 (Sioux Falls, South Dakota, versus Beaumont-Port Arthur, Texas). At the half-million cutoff, the spread was still almost 17 points (Madison, Wisconsin, versus Bakersfield, California).
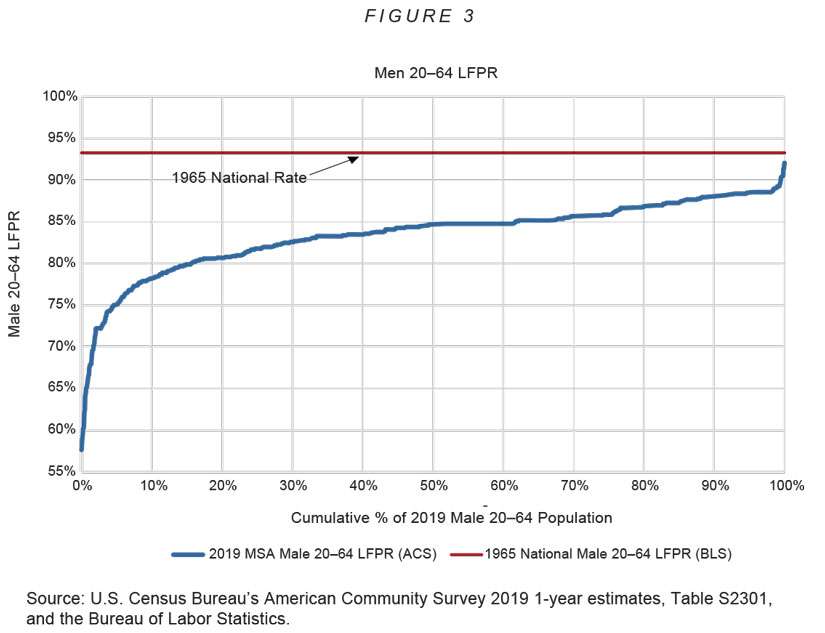
The tremendous range of LFPR readings is only one indication of the great dispersion of workforce-participation levels among localities. To get a better sense of the unevenness, we made a Lorenz curve of LFPRs for men aged 20 to 64, which shows the cumulative percentage of the population with less than a given participation rate.
We could make similar diagrams for other U.S. cohorts by age and sex, and they would all document great domestic variations in LFPRs.
For working-aged men (those aged 20 to 64), the national LFPR in 2019 was about 83%. In the top fifth of MSAs, though, the average rate was 88%, while it was just 77% for the bottom fifth. LFPRs in the top fifth were thus 11 points higher than they were in the bottom fifth. In other words, for every eight men working or looking for work in this low-LFPR quintile of the country's localities, there were nearly nine men similarly engaged in the highest quintile.
Naturally, the contrast between the top and bottom deciles of MSAs was even greater. The difference in LFPRs between the top tenth and the bottom tenth of MSAs works out to over 14 percentage points — or roughly seven men working or looking for work in the top decile of MSAs for every six men pursuing employment in the bottom decile.
Just how significant are these differences? Consider that in 2019, the mean LFPR for men and women aged 20 to 64 in the top 10% of U.S. metropolitan areas was reportedly 84.3% — virtually identical to the CPS's national average for 20-to-64-year-old college graduates (84.5%). Conversely, the mean LFPR for localities falling in the bottom fifth of the country's LFPR was 73.1% — below the CPS's national LFPR for men and women aged 20 to 64 with only a high-school education (73.2%).
As for men aged 20 to 64, nearly a fifth live in MSAs where this group's average metropolitan LFPR is below the national average for 20-to-64-year-old men with only a high-school degree (80.7%). A hardly negligible 2% of the country's men live in places where the overall local male LFPR is lower than the national average for men without a high-school degree (72.1%). This means that about 2 million men — and over 6 million men and women of all ages — live in localities where male LFPRs are lower than the deeply depressed LFPRs of male high-school dropouts nationwide.
The magnitude of the workforce-participation differentials between large numbers of metropolitan areas effectively approximates the gaps within the nation as a whole by socioeconomic standing. We have numerous towns and cities with the equivalent of national college-educated LFPRs, large numbers with the equivalent of national high-school graduate LFPRs, and too many with the equivalent of national high-school dropout LFPRs. And unlike the nationwide socioeconomic differentials in LFPRs so familiar to concerned citizens and public officials nowadays, these large local differentials — involving not just zip codes, but entire counties, cities, and even metropolitan areas — have yet to attract much notice.
DIFFERENCES WITHIN STATES
Not long ago, low LFPRs for American localities were a regional phenomenon, concentrated in troubled geographic areas that could encompass entire states or even sections of the country: Think of the Old South, Appalachia, and, more recently, the Rust Belt.
But this was back in the days when low employment levels meant high unemployment rates. Nowadays, low employment levels can be consonant with low unemployment — and often are. Thus, the regional geography of employment differentials also appears to have a new face. Localities with depressed LFPRs are still a feature of the American scene, but today, they are dispersed all around the country — often not far removed from towns, cities, and even metropolitan areas with much higher LFPRs.
The broad dispersion of both high- and low-LFPR communities is now a basic feature of the American landscape. In 2019, according to the ACS, 30 states contained at least one MSA above the 80th percentile for 20-to-64-year-old male LFPRs, and all but three contained an MSA within a standard deviation of the 90th percentile. Conversely, 35 states had at least one of the MSAs in the bottom decile. Nine states contained localities from both the top and the bottom LFPR deciles.
The wide dispersion of high- and low-performing localities means that state averages can conceal major internal differences in LFPRs. In fact, 18 states reported differences of 20 percentage points or more between their highest and lowest 2019 LFPRs for men aged 20 to 64. In California, the high-low difference was almost 23 percentage points (San Jose-Sunnyvale-Santa Clara versus El Centro); in Missouri, it was 28 points (Kansas City versus Farmington); and in Maryland, it was 27 points (California-Lexington Park versus Cumberland). But large spreads are not found everywhere. At the other end of the spectrum, the intrastate spread in Utah was three points, while Nebraska's was just one point.
Unexpected though it may be, the great majority of the differentials separating LFPRs across the country today are found within states, not between them. Familiar statistical measures for decomposing inequality reveal, for example, that nearly three-quarters of the overall variations in LFPRs by MSA in 2019 for men aged 20 to 64 were due to differences within states. If we went down to counties instead of MSAs, fully four-fifths of the variations in national LFPRs for 20-to-64-year-old men would be intrastate. The results for other components of the labor force would not be quite so lopsided, but they would be similar.
These 2019 data reveal a clear correlation between intrastate spreads in LFPRs and state-level LFPRs: the bigger the former, the lower the latter. That negative correspondence also held for other measures of variance. The relationship was no more than a moderate one, indicating that other factors had to account for most of the differences in LFPRs between states. Yet even so, these correlations were highly meaningful in statistical terms: A five-point spread in a state's LFPRs for males aged 20 to 64 tracked with a one-point decline in state-level LFPRs, plus a slightly steeper "slope" for the relationship with the LFPRs of the overall 20-to-64-year-old workforce.
The negative correlation between intrastate variations in LFPRs and state-level LFPRs raises larger questions about long-term trends in American workforce participation. We know that LFPRs for men have declined dramatically, almost continuously, since the 1960s. But has the dispersion in LFPRs by locality increased over time? Has inequality in LFPRs across American towns, cities, and metropolitan areas contributed to the national drop in LFPRs? If so, by how much?
Answering these questions should be a straightforward proposition, but it isn't. The trouble is that we have to work with a fruit salad of datasets that leaves us in the unsatisfying position of comparing apples to oranges. The ACS, which offers these fascinating insights into local LFPRs within America, is conducted annually, but it was not launched until 2005. The CPS offers annual jobs data dating back to the 1960s and even earlier, but with too small a sample size to comfortably examine LFPRs by locality. The full national census offers us terrific, detailed insights into local social and economic conditions, including employment patterns, but it is only available once a decade.
Yet even without an exhaustive march through the micro-data, these limited and only partly overlapping datasets provide some important clues. We can begin with the arithmetic of domestic LFPR dispersion.
Let's take another look at Figure 3, which shows the Lorenz curve for 20-to-64-year-old male LFPRs by MSA in 2019. Above that curve is a straight dark line, which marks the national LFPR for that same male cohort back in 1965. That year, the rate was 93.3% — almost 10 points higher than it was in 2019. Tellingly, not a single locality's 2019 LFPRs match — never mind exceed — the average U.S. LFPR from 54 years earlier. The non-intersection of those two lines speaks to a momentous downward shift in male LFPRs everywhere in America.
That said, some localities likely shifted their employment profiles downward more harshly than others. We can be pretty confident that there was a growing divergence in local LFPRs within America over those decades for two reasons.
First, the United States could not have achieved 1965 levels of male workforce participation with 2019 dimensions of intra-MSA LFPR dispersion. To maintain an overall 93% LFPR, there could be only so much arithmetic space for depressed communities to drag down the national average. If the America of 1965 somehow had the America of 2019's LFPR dispersion imposed on it, many towns and cities would have needed to report LFPRs of 100% and above for the nationwide numbers to average out to 93.3%. Since this is impossible, we know the variance in male LFPRs within the United States was lower in the 1960s than it is nowadays.
Second, the variance in male LFPRs between states has been rising steadily and significantly since the 1960s. CPS data cannot cast light on employment trends by city or town, but they are serviceable for tracking differences at the state level. They show that interstate differences in LFPRs for prime-age men rose almost relentlessly between 1980 and 2014 — a trend that continued up through 2019. The higher the NILF (not in labor force) rate nationally, the higher the variance in NILF rates between states.
With interstate variations by some measures doubling between the 1960s and the present, and intrastate differentials as pronounced today as we have indicated, it seems likely that nationwide variations in male LFPRs have increased appreciably over the past two generations — and that this dynamic has been driving national LFPRs down.
GEOGRAPHY AND DEMOGRAPHY
A generation and more of research on U.S. employment rates dedicated almost exclusively to national patterns seems to have inadvertently encouraged the mistaken impression that the national averages for workforce participation reported for various demographic, ethnic, and socioeconomic subgroups are fixed statistical relationships, as opposed to averages for the disparate readings actually observed around the country.
One of us addressed that misimpression in these pages in 2020 by highlighting the immense differences in LFPRs that co-existed over time within the population of U.S. prime-age men without high-school diplomas. On the one hand, foreign-born high-school dropouts who were married were as fully attached to the workforce as college graduates; on the other, native-born prime-age men who had never been married reported disastrously low levels of employment, with barely half working or even looking for work. Although LFPRs for prime-aged male high-school dropouts were severely depressed nationwide, a differential approaching 40 points consistently showed up between important subgroups within this overall category.
ACS data likewise demonstrate the importance of taking geography into account in LFPR disaggregation. Rather than a direct correspondence between national LFPRs and any given demographic or socioeconomic population characteristic, we see tremendous — and in some cases unexpected — variety across the country. This includes quite a bit of "crossover" — that is, examples of localities where groups with lower nationwide LFPRs exceed overall national levels, and sometimes even exceed levels for supposedly more "advantaged" segments of the nation. Consider some of the observed local differences in workforce-participation levels for groups with lower than (national) average LFPRs: women, black Americans, and people with a high-school education or less.
Observed local differences in LFPRs for women aged 20 to 64 spanned a range of 31 percentage points in America's MSAs in 2019. If we exclude small towns and limit our discussion to metropolitan areas, the differences in question are still imposing. In the Madison, Wisconsin, metropolitan area, the 2019 LFPR for women aged 20 to 64 was almost 84%, which is 24 percentage points higher than that of the metropolitan area of Lake Charles, Louisiana, and 27 points higher than that of Homosassa Springs, Florida.
No less noteworthy than these discrepancies are the crossovers, where local female LFPRs exceed local male rates or the national male rate. In over 40 of the roughly 500 MSAs for which we have data, LFPRs for females aged 20 to 64 were higher than the national male rate in 2019; these included places like Madison, Wisconsin; Rochester, Minnesota; and the Missoula metropolitan area of Montana. Just as intriguing is the fact that, in almost 40 MSAs with a total population of over 4 million, 20-to-64-year-old female LFPRs were higher than those of their male counterparts within those same MSAs. These localities were scattered all around the country. In Jefferson City, Missouri, LFPRs for women aged 20 to 64 edged out those of men by almost 12 percentage points. In most (though not all) of these places, male LFPRs were lower than the national average — but the same was not true for women. In quite a few of these locales, LFPRs were above the national average for women but below the national average for men.
Black America's LFPRs — likewise lower than average across the country as a whole — register striking variations as well. Nationwide, the civilian LFPR for black Americans aged 16 and over was 63.2% in 2019. But in Honolulu, Hawaii, the rate that year was almost 79%, which was far above the national average for all Americans. On the other hand, the LFPRs for blacks in the Salinas, California, metropolitan area was only 44% — that's a 35-point spread.
Perhaps surprisingly, LFPRs for black Americans aged 16 and over in 2019 were higher than those for non-Hispanic whites in over 130 MSAs that year, encompassing a total population of over 130 million and accounting for roughly 40% of the total U.S. population. But there is rather less here than meets the eye, since much of this particular surprise is explained by the confounding impact of population structure. Generally speaking, black communities in the United States are more youthful than white ones: The median age of America's black population in 2019 (35) was about nine years lower than that of its non-Hispanic white population (44).
Even so, there are spots on the map where the local black and white median ages are similar but black LFPRs are markedly higher. Take Charlottesville, Virginia, where the University of Virginia's main campus is located. In 2019, Charlottesville's median ages for blacks and non-Hispanic whites were essentially identical (42 years), but black LFPRs were reportedly nearly six points higher. In the Hinesville, Georgia, metropolitan area — home to Fort Stewart and the Third Infantry Division — the population in 2019 was much younger than it was in Charlottesville (with a median age of 30 for blacks, 31 for non-Hispanic whites), but overall LFPRs were six percentage points higher for blacks here, too.
We have a much better fix on LFPRs by educational attainment in America's localities in the ACS data. And these numbers also provide plenty of surprises.
Nationwide, LFPRs were predictably lower for men and women aged 20 to 64 with less education: four percentage points lower than average for those with just a high-school diploma, and 17 points lower for high-school dropouts. But there was nothing "average" about the actual LFPRs recorded for these ostensibly disadvantaged cohorts in communities around the nation. Despite the unfavorable odds facing persons without a high-school education, 88% of men and women aged 25 to 64 with less than a high-school degree were working or looking for work in Lawrence, Kansas, in 2019. That was nearly nine percentage points higher than America's overall rate for this group. In Kalispell, Montana (a metropolitan area with a population of 104,000), a jaw-dropping 95% of high-school dropouts in the 25-to-64-years-old cohort were in the labor force.
The flip side of these data is just as striking. In The Villages, Florida — the aforementioned retirement community — an awful lot of retirement seemed to be taking place among 25-to-64-year-olds with just a high-school degree: Their LFPR in 2019 was under 38%. And in the Cumberland, Maryland, metropolitan area (which includes portions of West Virginia), the LFPR for high-school dropouts aged 25 to 64 was a gruesome 16%.
From high to low, LFPRs for Americans with only a high-school diploma span a range of 50 percentage points in America's MSAs. For high-school dropouts, the range is an eye-popping 79 points. To add to the surprises, it happens that less-educated Americans outperform the national LFPRs in localities all around the country. In over 50 MSAs — jurisdictions accounting for a total population of over 15 million Americans — LFPRs for 25-to-64-year-olds with just a high-school diploma exceed the overall national rate for that age group. There are even MSAs where LFPRs for high-school dropouts exceed the national rate — 10 of them in fact, as of 2019. They included some of the places already mentioned: Fairbanks, Lawrence, Kalispell — but also places like Key West, Florida; Boulder, Colorado; and Casper, Wyoming. In all, over a million people lived in these outlier localities in 2019.
The circumstances in each of these expectation-defying localities — particularly the high performers among them — would be worth learning more about. For now, we may observe that these communities stand as living admonitions against the temptation to think of workforce-participation tendencies as governed by the iron rules preferred in structuralist thinking. The tremendous LFPR variations within America's social and economic subgroups highlight the need to think probabilistically about the relationship between social conditions and social outcomes — and, more generally, to appreciate the importance of contingency and human agency when undertaking social investigations.
SEEKING CAUSES
These vast differences in LFPRs across the country do not speak for themselves. They do not tell us what factors might be driving different outcomes or what relationships might exist between these varied local results and underlying local social conditions — the demographic, economic, and what we might call "cultural" factors that shape and influence LFPRs around the country.
A full readout of the statistical relationships we uncovered — on the correlates and determinants of local differences in U.S. LFPRs — must await another occasion. But a brief preview of this coming work may be in order here.
Statistical analyses of LFPRs at the local level court the risks of ecological fallacy — the detection of spurious relationships — given that the unit of observation is an aggregate community, not the individuals who compose it. We try to avoid that risk in the figure below, which compares LFPRs in 2019 for working-aged men (20 to 64) with the change in manufacturing jobs' share of employment over the previous two decades (2000 through 2019) by MSA. In this figure, if an MSA's proportion of employment in manufacturing went from, say, 45% in 2000 to 35% in 2019, its value along the X-axis would be -10.
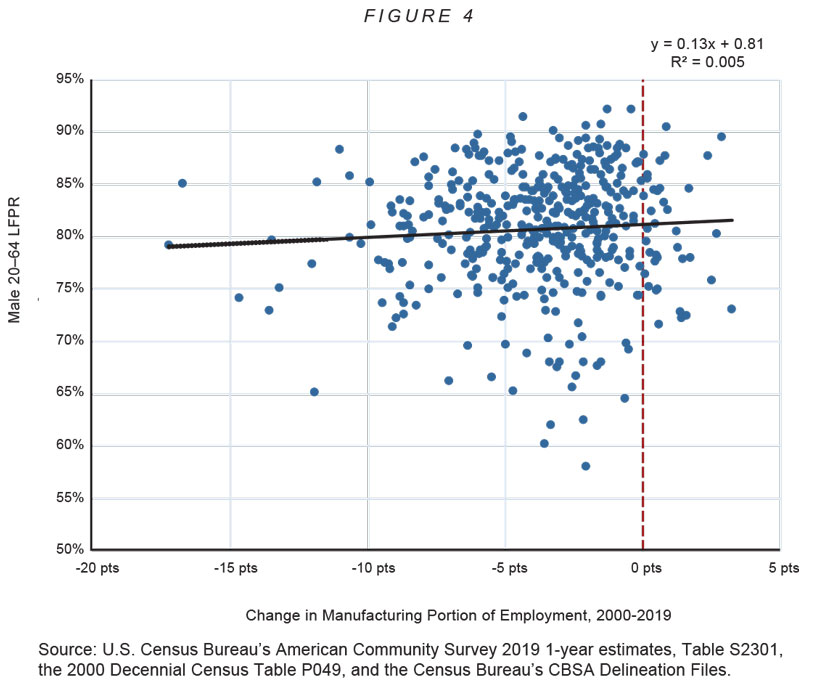
Plainly, there is no relationship at all between the two indicators in the chart. Typically, social scientists might be disappointed to discover an R-squared of less than 0.01 between two quantities under consideration. In this case, however, the finding of zero statistical association is not only meaningful but, in a policy sense, potentially significant.
For many years, a stylized fact floating in the economic policy ether (on both the left and the right) has been the now widely accepted notion that deindustrialization has driven down post-war LFPRs for American men. The figure above squarely challenges that assumption. Less ephemerally, careful studies by David Autor of the Massachusetts Institute of Technology and his colleagues have detailed the devastating impact of the "China shock" — the shift in worldwide trade patterns that followed China's accession into the World Trade Organization in 2001 — on the U.S. manufacturing sector. That immediate shock was, alas, very real, but our chart suggests it was also temporary. This figure, we believe, should be taken as an invitation to reexamine a matter many scholars and policymakers consider settled.
Another thought-provoking initial result concerns the striking geographical distribution of "over-performers" and "under-performers" across America. The map below highlights the puzzle. In 2019, almost all of the MSAs with the highest prime-age LFPRs for men and women were from the Upper Midwest, while the lowest LFPRs were scattered around the rest of the country — mainly across the Sun Belt.
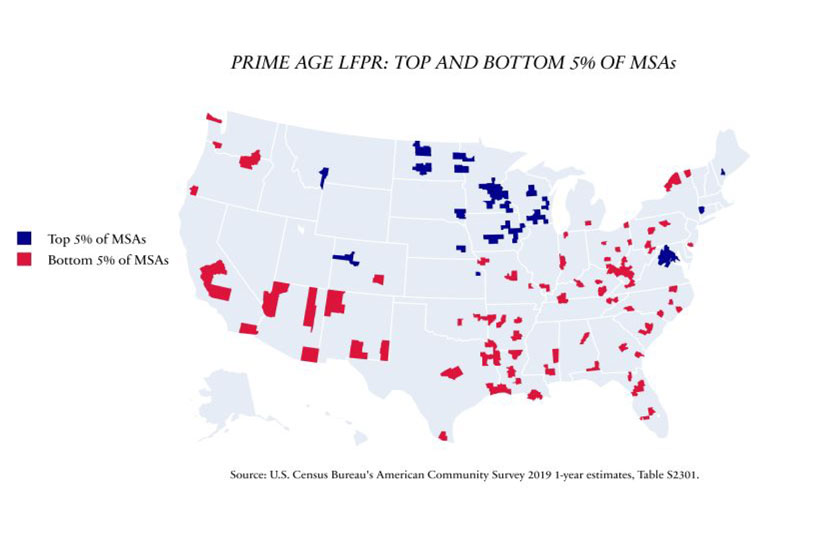
We tried to explain the performance of these outliers with the aid of measurable demographic, economic, and cultural variables like education, immigration, income, welfare dependence, crime, measures of social capital, and many more. Yet no matter what indicators we threw into the mix, we could not change the look of our map. Despite all our statistical controls, these same Upper Midwest locales kept showing up as spots with "high unexplained residuals" in our models, while many of the underachieving MSAs kept coming back as spots with the greatest "unexplained negative residuals."
This may mean the explanation lies in some combination of factors we have not conceived of, or in some set of factors that are not so easily measurable. Either way, there is a crucial and fascinating question to explore here.
Michael Barone, long-time editor of the Almanac of American Politics who has studied the United States on a county-by-county basis, had this to say about the map:
The metropolitan areas with the highest levels of labor force participation are concentrated in what I have called Germano-Scandinavian America, centered on Minnesota and including much of Wisconsin, Iowa, North Dakota and South Dakota....Metro areas with low or underperforming labor force participation include Greater Appalachia communities...American Indian concentrations...the Black Belt South...[and] Southwest Hispanics....The miscellaneous character of this group, as compared to the relative homogeneity of the high labor force participation areas, brings to mind Tolstoy's aphorism that all happy families are alike while each unhappy family is unhappy in its own way.
As these comments illustrate, answering some of the riddles posed by the geography of work in modern America will probably require an intimate familiarity with the American population in all its diversity, from sea to shining sea.
OPEN QUESTIONS
The huge variations in LFPRs between localities and jurisdictions in America offer scholars and policymakers a vast uncharted realm worthy of much further exploration. Improving our understanding of the reasons behind these imposing differentials between localities could yield not just academic benefits, but practical ones as well.
The reality of these variations appears to challenge some basic presumptions about our market economy. The United States has a single national labor market, and is subject to considerable and continuous population migration, both among states and within them. Yet despite all the factors that should conduce toward cross-national equilibrium in LFPRs, disparities between different population centers are stark. These discrepancies endure not just between states, but within them. What's more, the dispersion may have been growing over time, and its growth may play a role in dragging down the national LFPR.
LFPRs throughout much of the country are plainly depressed. For the bottom fifth of America's localities, the average overall LFPR in 2019 was lower than the national level for men and women with just a high-school education. For men alone, LFPRs in the bottom tenth of localities were only a couple of points above the national level for high-school dropouts. The situation is assuredly no better today.
Despite Europe's many travails and reputation for sclerosis, Europeans have managed to raise the continent's LFPRs steadily and substantially in recent years for men and women aged 25 to 64. In the United States, participation levels for their counterparts have been dropping since the late 1990s. Consequently, LFPRs for the 25-to-64 cohort are now higher in Europe than they are in the United States — and this is not just true in northern Europe, but also in places like France, Spain, and even Portugal. If America is going to reverse its workforce-participation decline, it is going to have to do so locality by locality — reducing some of the huge gaps we have illuminated here in the process.
We need to understand much more about the reasons for our country's disparate local workforce-participation profiles. Where does the policy environment figure in? Why do rates vary so much within states when state jurisdictions would seem to afford a single policy "climate" — and when economic "climates" seem to vary so materially between the states? Similarly, why are there such vast differences within demographic segments (especially racial groups and education subsets) whose prospects are thought to be structurally or systematically curtailed? And what about the correspondence between vacant positions and LFPRs at the local level? Federal statistical systems offer no information about these questions at present, but the U.S. employment situation would look less anemic if some of those 11 million job openings could be filled.
A better understanding of this puzzle will not only require more learning, however; it will also take some un-learning. Social scientists and policymakers tend to be infected with a whole array of unarticulated assumptions about work in America that simply do not comport with the facts on the ground. Mental tics picked up in graduate school — structuralism and other clutter — will have to be held in check or discarded altogether. For, at the end of the day, we cannot understand the differences in workforce participation in America's varied localities unless we are more familiar with the glorious variety of the human beings who inhabit them.
Indeed, this inquiry is ultimately an enticing invitation to get to know our fellow citizens better.