Progressivity, Redistribution, and Inequality
Last October, a new controversy erupted over the progressivity of the American tax system. The brouhaha was prompted by a new book, The Triumph of Injustice, by economists Emmanuel Saez and Gabriel Zucman. In it, the authors claim that the highest-earning Americans' tax rate has fallen below everyone else's.
Saez and Zucman's work has had a profound effect on the national conversation about inequality and taxes. Indeed, claims like theirs have helped lay the intellectual foundation for progressives' latest redistribution proposals, including wealth taxes. Given how readily many in politics and the media have accepted Saez and Zucman's claims, someone first tuning in to the economic-policy discussion today could be forgiven for believing that tax-progressivity questions have received little serious study in the past — or that the available data and analyses support these new findings.
In reality, however, Saez and Zucman's conclusions represent a substantial departure from existing research on tax progressivity and the redistributive effect of the U.S. tax-and-transfer system. Lawrence Summers, Treasury secretary under President Bill Clinton and director of the National Economic Council under President Barack Obama, declared at a Peterson Institute event that after "very close study of the Twitter wars...surrounding the work of Saez and Zucman...I find myself about 98.5% persuaded by their critics that the data are substantially inaccurate and substantially misleading." Greg Mankiw, chairman of the White House Council of Economic Advisers under President George W. Bush, similarly remarked at the same meeting, "[s]uch presentations of the data are incomplete to the point of being deceptive."
Saez and Zucman make two novel claims in their book. First, they assert that the U.S. tax system, instead of being progressive, consists of "a giant flat tax — except at the top, where it's regressive." Second, they argue that the tax code has become substantially more regressive over time. While there remain opportunities for further research and debate regarding methodology, the weight of the evidence tells a consistent story — one that differs markedly from Saez and Zucman's narrative.
MEASURING TAX PROGRESSIVITY
Before delving into the details of the debate, it's worth explaining what economists mean by "tax progressivity" and its opposite, "regressivity." The progressivity of the tax code is determined by comparing the average tax rate — taxes divided by income — across different income levels. A tax system that imposes a lower average tax rate on low-income households than on high-income households is progressive. A system that imposes a higher average tax rate on low-income households than on high-income ones is regressive.
To measure progressivity, it is necessary to properly determine the distribution of both household taxes and household income — a task that requires distinguishing between the statutory burden of a tax (i.e., who remits the tax payment to the government) and the economic burden of the tax (i.e., who ultimately bears the cost). In the case of state and federal income taxes on individuals, economists generally agree that the economic burden of the tax falls on the taxpayer, just as the statutory burden does. In the case of the corporate income tax, for which the statutory burden is imposed on the corporate entity itself rather than on individuals, the Congressional Budget Office (CBO) and the Joint Committee on Taxation assume that capital bears three-fourths of the economic burden and workers bear one-fourth (however, this is an area of ongoing research). As for labor taxes, economists generally agree that regardless of where the statutory burden is imposed, the economic burden falls on workers. For example, in the case of the payroll tax — for which half of the statutory burden is imposed on the worker and half on the employer — the economic burden is assumed to be borne entirely by workers. Finally, the economic burden of excise taxes and general sales taxes are usually considered to fall on consumers regardless of whether they are remitted by consumers or retailers.
Measuring household income can be difficult. Although wages, dividends, interest, and capital gains are easily observed on tax returns, measuring other types of income is not as straightforward. The value of employer-provided health insurance, for example, is a large and growing source of compensation that is not reported on tax forms. Whether pension income is assigned to households when it is earned or when it is distributed during retirement affects the allocation of income between working-age and retired households. Even defining a household can be tricky. Is a college student who is financially dependent on his parents but files his own tax return and lives alone part of his parents' household, or a separate one?
A related challenge is the proper treatment and measurement of transfer payments such as housing subsidies, food stamps, Medicaid, and Medicare. The values of these services and subsidies should be accounted for when measuring a household's tax burden relative to its income. However, similar policies can look very different depending on whether they are designed as a tax subsidy or as a spending program. If a program is considered a tax cut, then it reduces the numerator in the tax-progressivity equation. If it is deemed a transfer payment, then it increases the denominator. This difference, though it might be inconsequential to the recipient, can significantly alter the measure of a tax system's progressivity.
Furthermore, important considerations regarding where the tax system ends and other government services begin need to be taken into account. If a federal program that primarily benefits low-income households is included in the tax-and-transfer system, it will make the system appear more progressive. If it is excluded, the system will appear less progressive.
For example, the Supplemental Nutrition Assistance Program (SNAP) is a federal cash-assistance program for low-income households that raises a household's net income by providing it with money to be used for purchasing food. Theoretically, SNAP could operate as a refundable tax credit instead. Additionally, one could imagine the federal government offering free meals to low-income households through SNAP, which would not be considered a tax or a transfer.
Consider, for example, a single parent earning minimum wage and making $1250 per month while receiving $450 in monthly SNAP benefits. If SNAP benefits are counted as income, this household's tax rate would fall as the denominator increases when total measured income increased to $1700 per month. If those same SNAP benefits are counted as a refundable tax credit, the household's tax rate would decrease even more as the numerator drops by $450 while the denominator remains unchanged. And finally, if SNAP benefits are excluded from the calculation entirely, the program would have no impact on the household's tax rate. Given that SNAP benefits are a considerable amount relative to wage income for low-income households, the consequence of how one treats this benefit for the purposes of calculating tax burdens is large.
A final challenge to accurate measurement on this front involves changes over time. Traditional tax analysis measures progressivity based on a snapshot of one year's income and taxes. Because households frequently move between tax brackets over their lifetimes, however, this truncated view leads to important biases in the perceived progressivity of the tax code. For example, a first-year medical resident's salary is not reflective of his future expected earnings. Similarly, a mid-career coder at a technology start-up whose company just went public could see a one-time windfall equivalent to what a senior executive earns annually. As a result, measurements of the progressivity of the tax code that take into account lifetime taxes and income can differ substantially from measurements that rely on one year of taxes and income.
Compared with current-year estimates of income and taxation, this longer-term view requires one to make significant assumptions in order to infer past and future income from current income. But this is an important complement to traditional tax analysis that will continue to improve as more and better data become available. In particular, changes in the rate of income mobility can affect the distribution of lifetime post-tax-and-transfer income even if the distribution of household income is constant in a single year. Tracking household incomes over time, therefore, will provide policymakers with important insights.
OUR PROGRESSIVE TAX SYSTEM
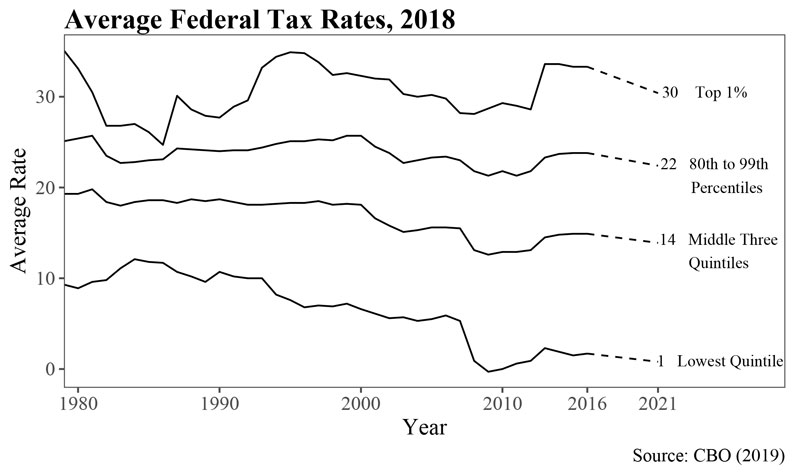
Thanks to detailed research by the nonpartisan CBO, we know more about the long-term trajectory of the progressivity of federal taxes than of state and local taxes. According to the CBO, from 1979 to 2016, the average federal tax rate for the top 1% of households has fluctuated between 24.7% (in 1986) and 35.1% (in 1979). Under Republican presidents, that rate tends to fall; under Democratic presidents, that rate tends to rise. In 2016, the most recent year for which the CBO has reported estimates based on historical data, the average tax rate for the top 1% was 33.3%. As a result of the 2017 tax cuts, the average tax rate is projected to fall to 30.4% in 2021. The average federal tax burden on the highest-earning households is thus well within the range of historical norms.
For low- and middle-income households, average federal tax rates have been gradually decreasing. The average tax rate on the middle three quintiles slowly declined from 19.3% in 1979 to 12.6% in 2009 during the Great Recession, before rebounding to 14.9% in 2016. The CBO projects the rate to be 13.9% in 2021. Federal tax rates on the lowest quintile of Americans have declined more dramatically, peaking at 12.1% in 1984, reaching as low as -0.3% in 2009, and increasing slightly, to 1.7%, by 2016. The projected 2021 federal tax rate for the lowest quintile is 0.8%.
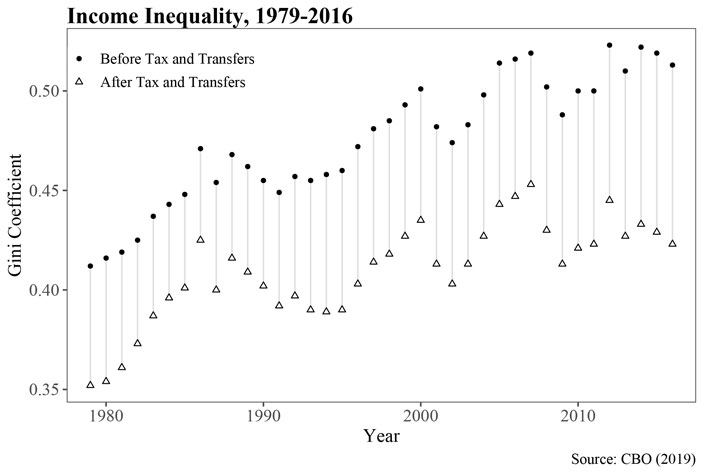
The extent of redistribution through the federal tax-and-transfer system over time can be quantified by examining changes in the difference between the level of income inequality before taxes and transfers and the level of income inequality after taxes and transfers. Redistribution is partially driven by changes in the progressivity of the tax-and-transfer system and partially by its size. Equal levels of redistribution can be achieved through either systems that collect more revenue and spend it more evenly or systems that collect a relatively small amount of revenue but spend it in such a way that all of the benefits go to those at the bottom of the income distribution.
The CBO measures the extent of redistribution in the federal tax-and-transfer system by comparing the Gini coefficient for income before taxes and transfers to the Gini coefficient for income after taxes and transfers. The Gini coefficient is a statistic that measures the dispersion in income across households. The coefficient is zero if all households have the same income; if one household earns all of the income, the coefficient becomes one. In 1979, the difference between the pre- and post-tax-and-transfer Gini coefficients was 0.06. By 1986, the difference had narrowed to 0.046. Over the next 30 years, the difference almost doubled to 0.09 by 2016. In 2021, it is projected to narrow slightly, to 0.084.
We do not have longitudinal data on state and local taxes that are as detailed as the estimates of federal tax progressivity. Furthermore, the contribution of state and local taxes to overall tax progressivity differs across states. A 2016 study by Frank Sammartino and Norton Francis of the Urban-Brookings Tax Policy Center finds that state and local income taxes are progressive, although less so than federal income taxes. A 2018 study by the Institute on Taxation and Economic Policy, which includes excise taxes and property taxes, finds that state taxes are modestly regressive, ranging from 11.4% for the bottom quintile to 7.4% for the top 1%. However, given that state and local taxes account for only a third of all taxes, even the most extreme assumptions about state and local taxes cannot offset the progressivity of the federal tax code.
So why do Saez and Zucman conclude that the overall U.S. tax system — state, local, and federal taxes combined — is regressive? First and foremost, they disregard long-standing practices of policy analysts studying the distributional effects of the tax code. Fortunately for us, economists Gerald Auten and David Splinter have done the yeoman's work of replicating Saez and Zucman's analysis, re-analyzing the data using traditional modeling assumptions, and detailing where and why the two estimates differ.
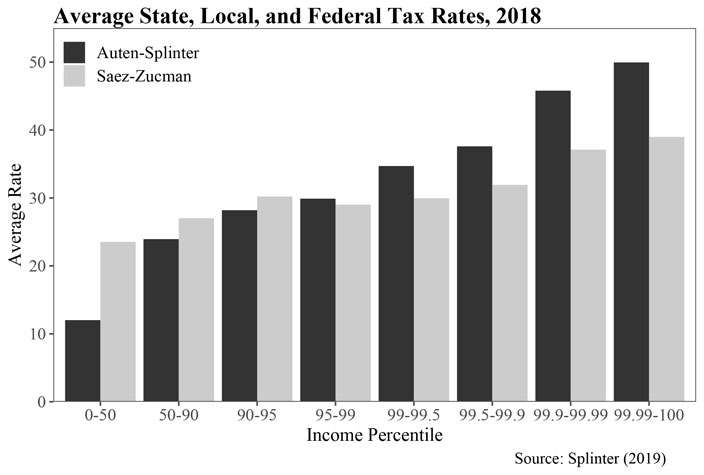
Saez and Zucman estimate that the average state, local, and federal tax rate for the bottom 50% of American households was around 25% in 2018. Auten and Splinter's model, in contrast, estimates the average tax rate to have been 12% that same year. What accounts for the difference? As explained above, traditional tax analysis includes government transfers, employer-provided health care, and employer-paid payroll taxes as income. Saez and Zucman exclude these income sources, making lower-income households appear poorer. As a result, the average tax rate of these households in Saez and Zucman's work is twice as high as it would be under standard techniques.
For low-income households that receive a large proportion of their income from means-tested government transfers, Saez and Zucman's approach is even more misleading. Focusing solely on taxes ignores the means-tested government transfer programs — including SNAP and housing subsidies — that low-income households receive. Saez and Zucman's analysis reports that taxpayers in the bottom 10% of the income distribution pay taxes in excess of a quarter of their income. In contrast, former White House Council of Economic Advisers Chairman Jason Furman's analysis treats means-tested transfers as if they were negative taxes and calculates that post-tax-and-transfer income for the bottom quintile exceeds pre-tax-and-transfer income by over 60%. Alternatively, if these transfers are included in income, poor households have much higher incomes and much lower average tax rates than Saez and Zucman's model would suggest.
Moreover, many benefits targeted at low-income households are not reported on tax forms, and self-reported data on transfers are notoriously inaccurate. Recent research by economists Bruce Meyer and Nikolas Mittag merges administrative data from New York state with surveys from the U.S. Census and finds that households with incomes between 50% and 100% of the poverty line receive means-tested transfers equal to just over 50% of their reported money income. Meyer and Mittag emphasize, however, that Census respondents tend to severely underreport means-tested transfers. In New York, for example, households at or below the poverty line report around half of the total assistance they receive.
Calculating tax rates for very high-income households may be even more difficult — and thus even more susceptible to divergent results — than calculating them for low-income households. Income for high-earning households is a mix of wages, investment income, various types of corporate income, retirement and pension income, inheritance income, and other wealth transfers. The population of very high-income households also consists of a very small number of people, and these individuals have extremely high annual incomes and personal wealth, meaning estimated average tax rates are especially sensitive to differences in data imputations.
Because there is a great deal of popular interest in pinning down the tax rates of these households, the IRS provides annual summary statistics on the tax returns of the top 0.1%, 0.01%, and even 0.001% of tax filers. Saez and Zucman augment these IRS data with other information from the Forbes "Top 400" list and then make other assumptions.
Based on these inputs, Saez and Zucman estimate that the average state, local, and federal tax rate of the top 0.1% of adults was 31% in 2018 and 35% in 2015, down from 40% in 1993 and 53% in 1968. Auten and Splinter's methodology, in contrast, finds a top 0.1% average tax rate of 51% in 2015, up from 46% in 1993 and 47% in 1968.
Two major assumptions account for the difference in estimated average 2018 tax rates. First, Saez and Zucman assume that high-income taxpayers underreport a greater proportion of their income than low- and middle-income taxpayers do. This assumption is simply inconsistent with what IRS audit studies have found. Second, Saez and Zucman assume that high-income households account for a much larger proportion of untaxed retirement income than Auten and Splinter assume. This is because Saez and Zucman incorrectly allocate rollovers of retirement accounts as income from wealth, a technical error that artificially inflates top incomes and therefore lowers tax rates for high earners.
What's more, Saez and Zucman assume that the entire burden of corporate income taxes is borne by stockholders. Ironically, because very high-income households also own an outsized proportion of corporate stock, this assumption leads to higher estimated progressivity for the tax system overall. However, it also means that their analyses represent recent decreases in corporate tax rates as significant tax cuts to the highest-income households, contributing to the finding of a downward trend in progressivity over time. Auten and Splinter, consistent with prior work, assume that the burden of the corporate tax is spread more evenly through the income distribution, with some falling on workers through lower wages and some spilling over to other types of capital. Based on this assumption, they find that lower corporate taxes lead to lower tax rates for more households.
Finally, the best available evidence suggests that the one-year snapshot used in traditional tax analysis tends to underestimate tax progressivity relative to a lifetime view. Economists Alan Auerbach, Laurence Kotlikoff, and Darryl Koehler combine longitudinal survey data with an economic model of lifetime spending to estimate the long-term trajectory of household earnings and taxes. When examining households with individuals aged 40–49, the authors find that the snapshot approach to tax analysis understates the progressivity of the tax code. For the lowest quintile of earners, they estimate a lifetime tax rate of -46.6%, compared with a -9.8% rate based on current-year income. For the second quintile, the lifetime and current-year tax rates are 4.2% and 18.1%, respectively. In contrast, for households in the top quintile, lifetime and current-year tax rates are more in line with one another: 31.3% versus 34.9% for the top 5% of earners, and 34.5% versus 38.2% for the top 1%.
Taken together, the data strongly suggest that the tax code is progressive and has become more progressive over time. Saez and Zucman's multiple departures from standard methods used in prior analyses of progressivity and redistribution promote misleading conclusions about tax rates for low-income and high-income households, as well as on how trends in these rates have changed over time. Furthermore, additional research on errors in the reporting of means-tested transfers to low-income households and the lifetime incidence of taxation indicates that standard methods tend to underestimate, not overestimate, the extent of tax progressivity.
REDISTRIBUTION AND INCOME INEQUALITY
Of course, just because the best evidence suggests that the U.S. federal tax code and transfer programs have become more progressive over time does not necessarily mean that they are sufficiently progressive. The gradual increase in progressivity is happening against a backdrop of rising inequality in before-tax incomes. Moreover, increased redistribution via taxes and transfers has not kept up with the general trend of income growth among the richest Americans outpacing the growth of low- and middle-income households.
Yet it is simply not true that all of the income growth of the past 40 years has occurred at the top of the distribution, as is often claimed. According to the CBO, real average incomes for the top 1% of households were 2.2 times higher in 2016 than in 1979, compared with 75% growth for top-quintile incomes and 33% growth for the bottom 80% of households over that same period. As a result, the Gini coefficient for before-tax income in the United States increased from 0.412 to 0.513 during this period. Modest increases in redistribution via the tax-and-transfer system only make a small dent in that trend.
When policymakers or voters make the case that the tax system has become less progressive, they most likely mean that inequality in after-tax-and-transfer income has increased despite the increased progressivity of the tax system. In other words, increases in redistribution have not kept up with growing income inequality. This is indeed the story the data tell.
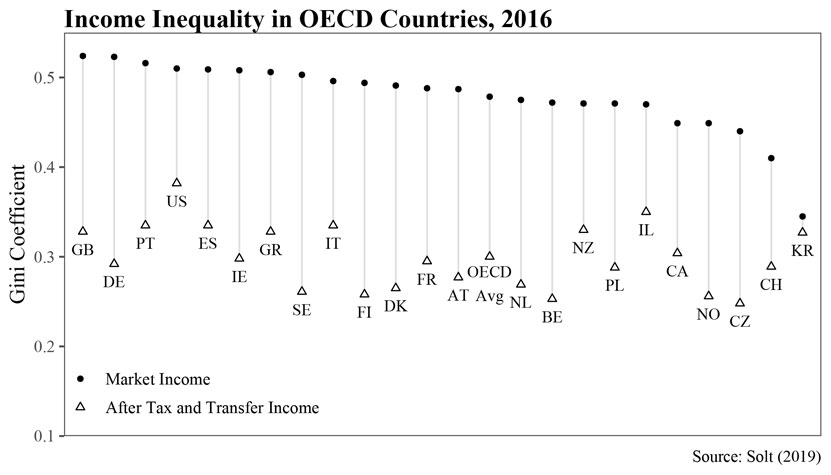
When we compare the United States to other developed countries, however, the data tell the opposite story: The culprit for greater after-tax-and-transfer income inequality compared with our peers is the tax-and-transfer system. Perhaps surprisingly, the inequality of market incomes of U.S. households is very much in line with that in other large developed Western nations. According to the Standardized World Income Inequality Database, a project that seeks to make apples-to-apples comparisons of global inequality statistics, the U.S. Gini coefficient for market income — which includes wages and investment income — is not significantly different from the Gini coefficients in France, Germany, Italy, Spain, or the United Kingdom. In other words, the data do not support claims that there is something uniquely unequal about American capitalism.
However, the difference between the Gini coefficients for market income and post-tax-and-transfer income in the United States is significantly smaller than it is in Organization for Economic Cooperation and Development (OECD) countries. As a result, the Gini coefficient for after-tax-and-transfer income is significantly higher in the United States than it is among our peer nations. And this divergence has increased over time due to increases in redistribution in other countries that have been larger than those that have occurred in the United States.
Why does America redistribute less than other nations do? The foremost explanation is that America's values differ from those of other developed countries. The World Values Survey has included the United States in its cross-country questionnaire since 1995. On a scale from 1 to 10 — with 1 being "incomes should be made more equal" and 10 being "we need larger income differences as incentives for individual effort" — the average U.S. response of 5.5 in 1995 was only marginally higher than the average OECD response of 5.4. Since then, however, the OECD average fell to 4.9 in 2011, while that of the United States increased to 5.6.
In addition to being more comfortable with inequality than our peers in other countries, Americans also believe that people should be more self-reliant than citizens of other OECD nations do. Only in New Zealand — a country with significantly more equal market incomes among its citizens — do respondents agree more strongly that people should be prepared to take care of themselves as opposed to having the government ensure that everyone is provided for.
The argument that America redistributes less than other countries because wealthy households have more power in the United States than wealthy households do elsewhere is much less convincing than the values-driven explanation. The theory that market inequality leads to elite demand for less redistribution fails to explain why other countries with roughly equal dispersions in market incomes redistribute so much more than the United States does. Political-party affiliation in the United States is much better predicted by age, race, religion, and education than by income level. Finally, according to recent research by political scientist Viveknan Ashok and economists Ilyana Kuziemko and Ebonya Washington, the gap in the desire for redistribution across income groups has been shrinking over time, which conflicts with theories that predict higher inequality leads to greater opposition to redistribution from those for whom it would be most costly.
A FOUNDATION OF SHARED FACTS
According to a January 2020 survey conducted by the Pew Research Center, there is a significant partisan divide over issues related to inequality and progressivity. Among Democratic voters, 78% believe there is too much income inequality, compared with just 41% of Republican voters. And 56% of Democratic voters believe that the tax system is a major contributor to inequality, compared with just 30% of Republicans.
But the answer to that question is more than just a matter of political opinion. It is, at its core, an empirical question. And that is why questions over measurement and historical trends matter. Saez and Zucman's claim that the tax system has grown less progressive over time has obvious appeal for those advocating new taxes on high-income households. But their analysis is riddled with assumptions that depart from decades of research on tax progressivity and redistribution — and do so with little substantive justification. The risk their departure entails is that the debate over the future of tax policy will lose its basis in shared facts. As a result, rather than having the discussion our country needs about the best way to achieve shared prosperity, the political debate will devolve into a squabble over which model better supports one's prior political beliefs.
It is therefore worth concluding with three sets of facts about the tax code that serve as a useful starting point for any healthy debate on the future of tax progressivity in the United States. First, the overall tax system is indeed progressive, and the federal tax code has become more progressive over the past half-century. Second, increases in redistribution through the tax-and-transfer system have occurred more slowly than increases in market-income inequality, leading to greater inequality in after-tax-and-transfer income. Third, other large Western nations with market-income inequality levels similar to those in the United States redistribute more than the United States does, and not because wealthy American households have a uniquely high degree of leverage in the system, but because these other countries have values with respect to inequality and redistribution that differ from those of Americans generally.
If our debates about inequality began from these premises, we would be better able to debate whether our concerns about inequality point toward policy changes. That debate is well worth having, but it can only be constructive if it is rooted in reality.